Overview
Your Rock server can record lots of information about your
visitors, but getting that information often requires knowledge of SQL. The Site Analytics plugin provides an easy-to-understand
interface to see all kinds of information about the visitors to your sites.
If your Rock database is hosted in the cloud, then you may
need to allow some extra grace when viewing analytics over a large date range.
These calculations are quite intensive and often include tens of millions of
records to be counted and calculated. Third party analytics systems have
servers fine-tuned and dedicated to these calculations. Your server is most
likely not fine-tuned and certainly is not dedicated to these requests. In
addition, when hosted in the cloud your server usually has less horsepower
behind it than you would expect.
Configuration
Your Rock server may already be configured to record all
this information, but you should check to be sure. Under your Admin Tools, go
to the CMS Configuration section. Then go to the Sites page. Open each each
site you want to enable recording, and later viewing, of analytics data. In the
Advanced Settings panel make sure Log Page Views is turned on.
If you have a value in the Page View Retention Period,
you may want to review that to ensure you are keeping enough data for the
analytics to be useful. You will probably want to keep this set to at least 2
or 3 years (1095 days) if not longer. The more data you keep around the further
back you can go when comparing numbers.
This plugin will also show you analytics on your mobile and
TV applications. So if you have any Rock powered mobile or TV apps you will
find the same Log Page Views and Page View Retention Period
values on those as well.
Note
Please note that initial performance may be slightly slower as interaction data is loaded into SQL Server's cache, but subsequent use will be much faster.
Site Analytics Sections
After installation, the Site Analytics plugin can be accessed from Admin Tools > Installed Plugins > Site Analytics.
Overview
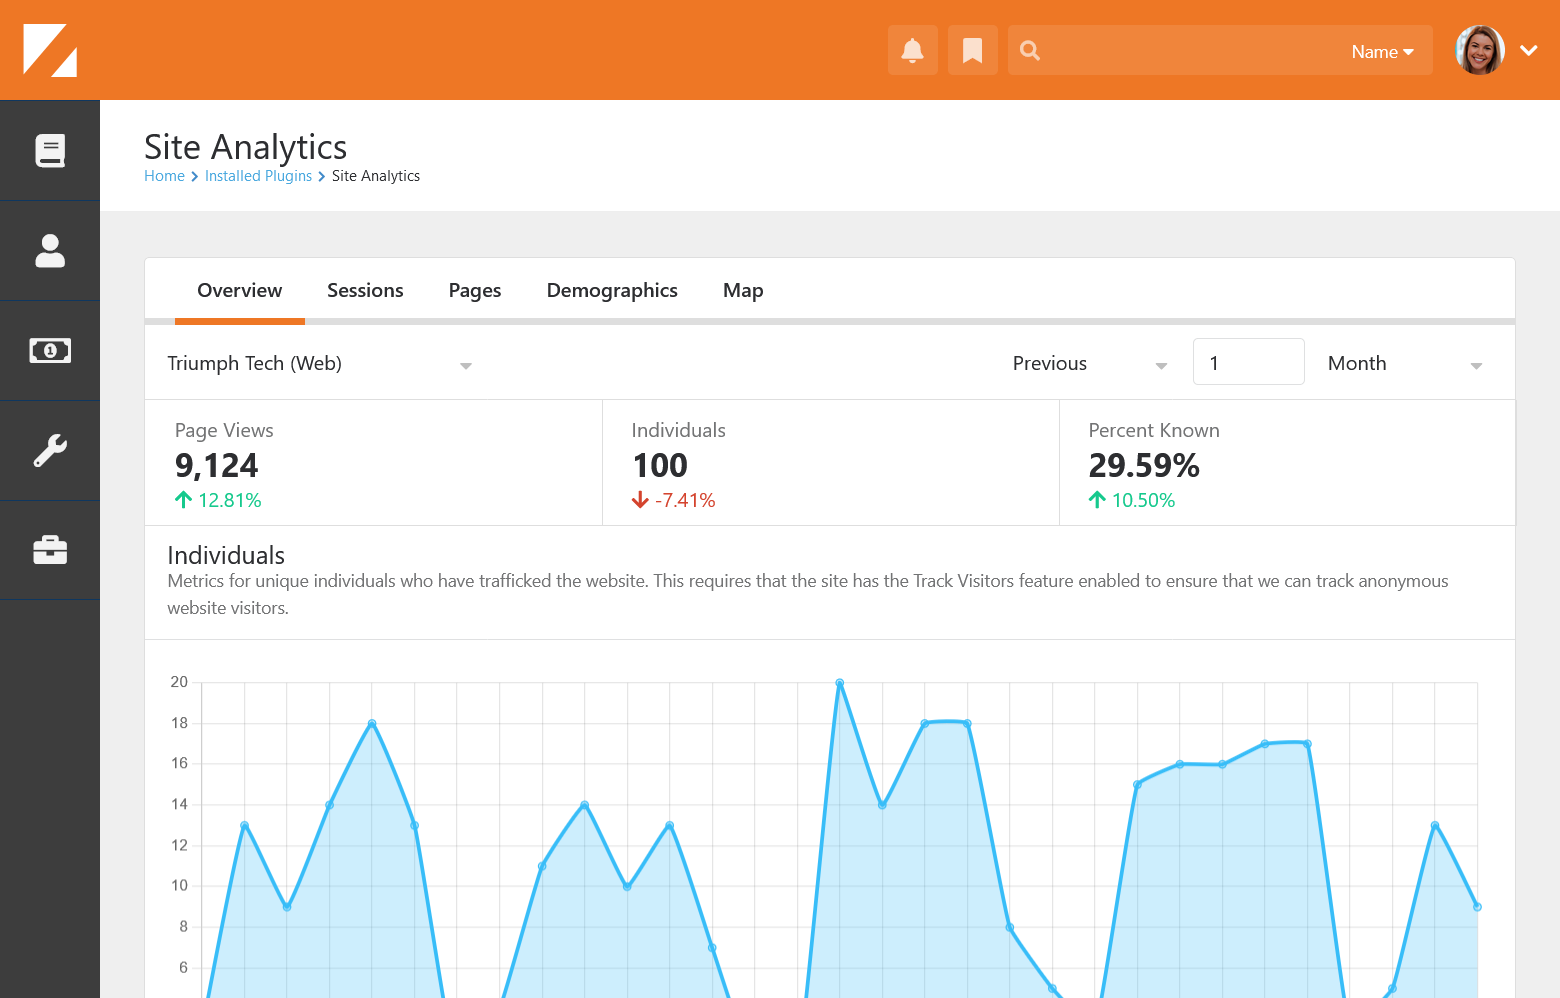
The overview tab
provides valuable insights into the performance and behavior of your site. From
this tab you can track and analyze various metrics, such as:
- Page Views: This metric shows the total number of page views that your site has received during the selected date range. A page view is counted when a visitor loads or reloads a page on your site. This metric can help you measure the popularity and engagement of your content.
- Individuals: This metric shows the number of unique individuals who have visited your site during the selected date range.
- Percent Known: The percentage of "known", logged in users for the selected date range.
- Client Type: This metric shows the distribution of different types of clients that are accessing your site. A client type on a “Web” site includes, Desktop, Mobile and Tablet. This metric can help you optimize your site design and functionality for different platforms and devices.
Sessions
The sessions tab Sessions are a group of
interactions that a visitor performs on your site within a given time frame.
A session can include interactions including page views, media watches, and other
actions.
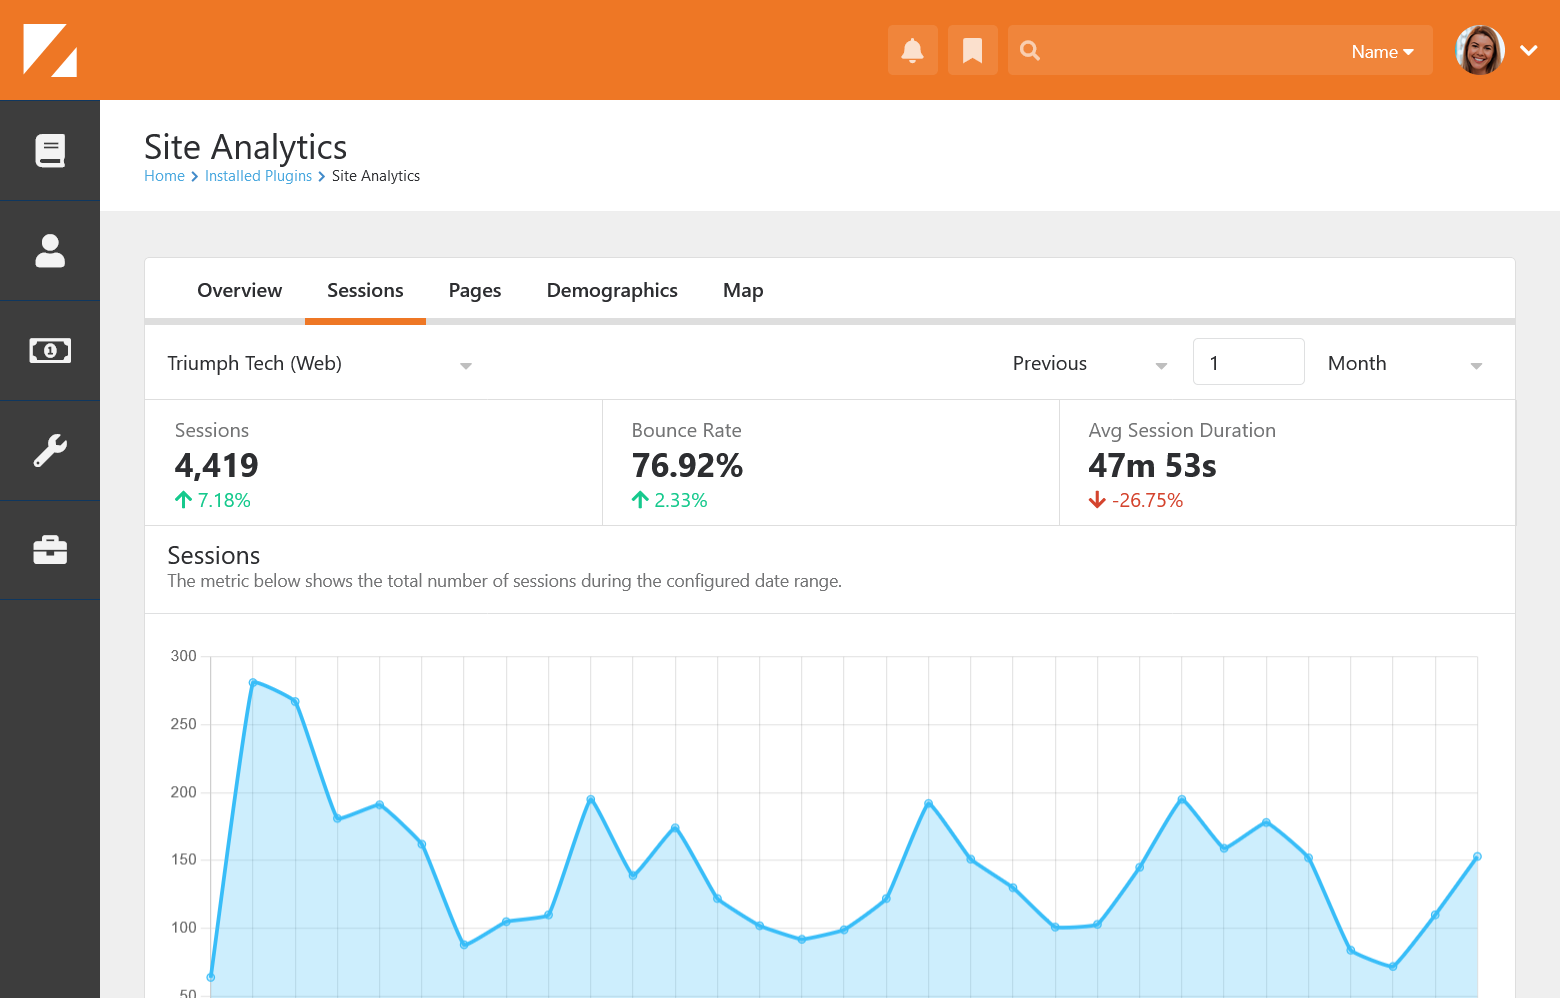
You can use the plugin
to measure and compare the following metrics related to sessions:
- Sessions: This metric shows the total number of sessions that your site has received during the selected date range. This metric can help you evaluate the overall traffic and engagement of your site.
- Bounce Rate: This metric shows the percentage of sessions that had only one page view and no other interactions. A high bounce rate can indicate that your site is not relevant, attractive, or user-friendly for your visitors.
- Average Session Duration: This metric shows the average length of time that visitors spent on your site during a session. A longer session duration can indicate that your site is providing valuable and engaging content for your visitors.
Pages
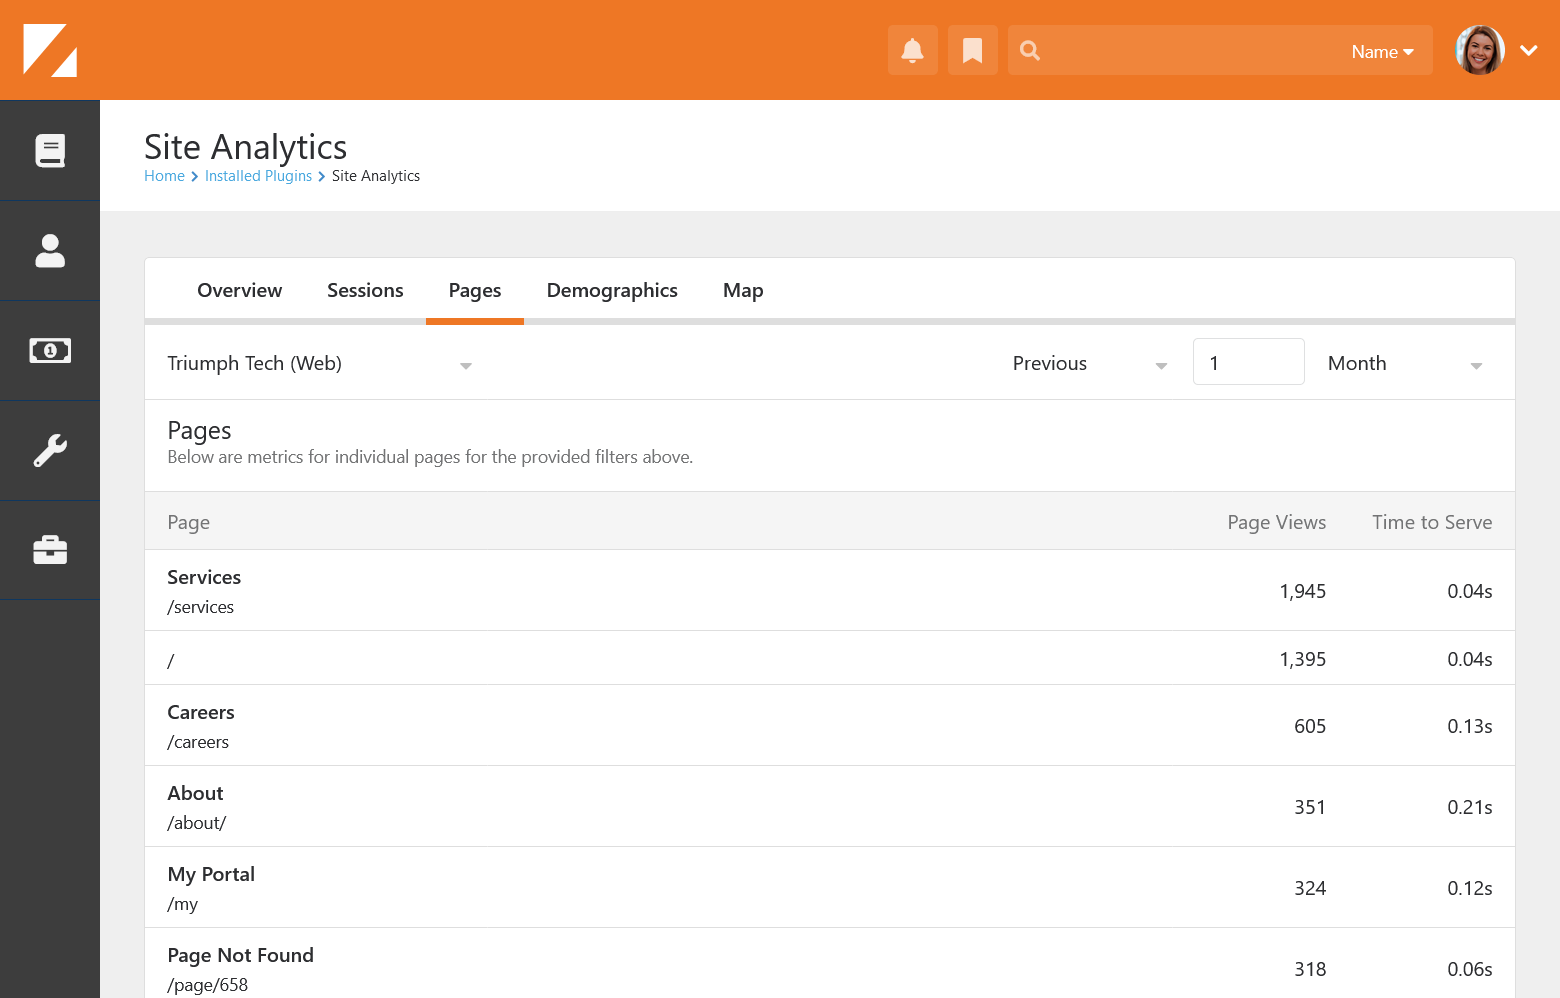
The pages tab includes a list of all the pages visited during a given time frame and includes the following details
- Page: The title of the page as it appears on your site.
- Page URL: The URL of the page as it appears in the browser address bar.
- Page Views: Shows the number of times the page was viewed by visitors during the selected date range. This metric can help you evaluate the popularity and demand of the page content.
- Time to Serve: The average time it took for the page to be served from Rock. This metric can help you optimize the speed and performance of the blocks, Lava, and SQL on the page.
Demographics
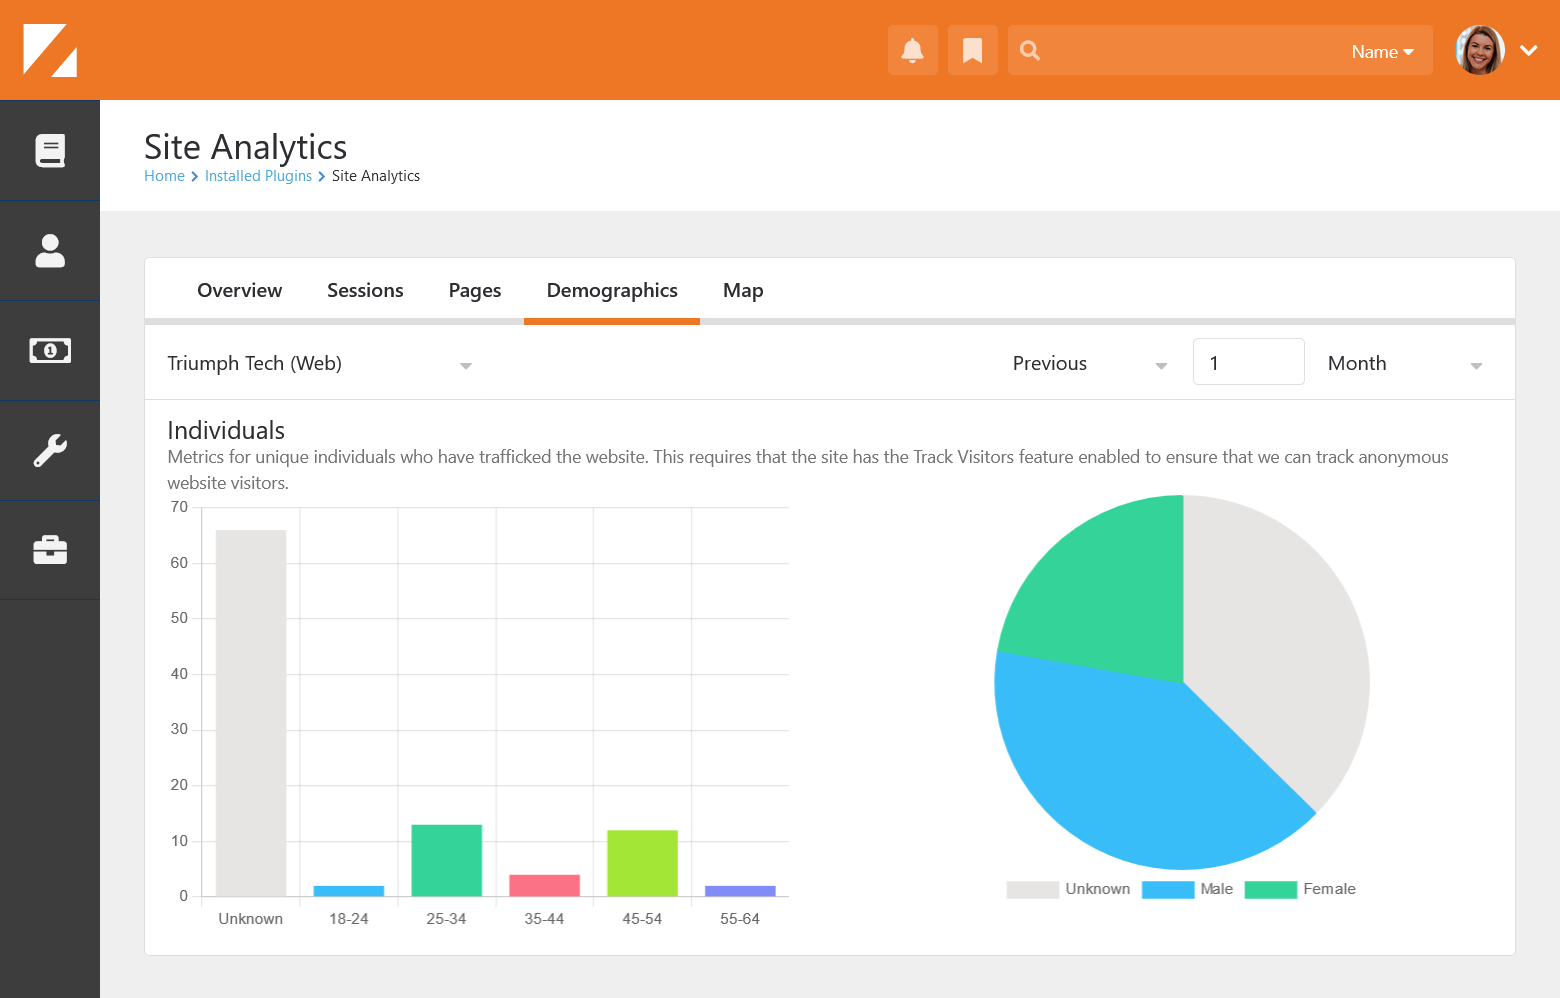
From the demographics
tab you can measure and compare the following metrics:
- Age: This chart shows the distribution of different age groups among your visitors based on the provided birthdate of a user. This metric can help you tailor your site content and design to suit the needs and interests of different age segments.
- Gender: This metric shows the distribution of male and female visitors on your site.
Map
The map tab allows you to visualize and compare the geographic distribution and sources of your traffic using Rock's "IP Address Location Service" capabilities.
- Country Map: This element shows a world map with different colors representing the number of visitors from each country. You can hover over a country to see the exact number of visitors.
- Source Chart: This element shows a bar chart with each bar representing a different country sources of your site traffic.
FAQs
Q: Why do I see a steep drop-off of traffic in my historical data?
A: If you see a sudden decrease in your traffic data, it was likely due to a change in core to filter out interactions from bots.
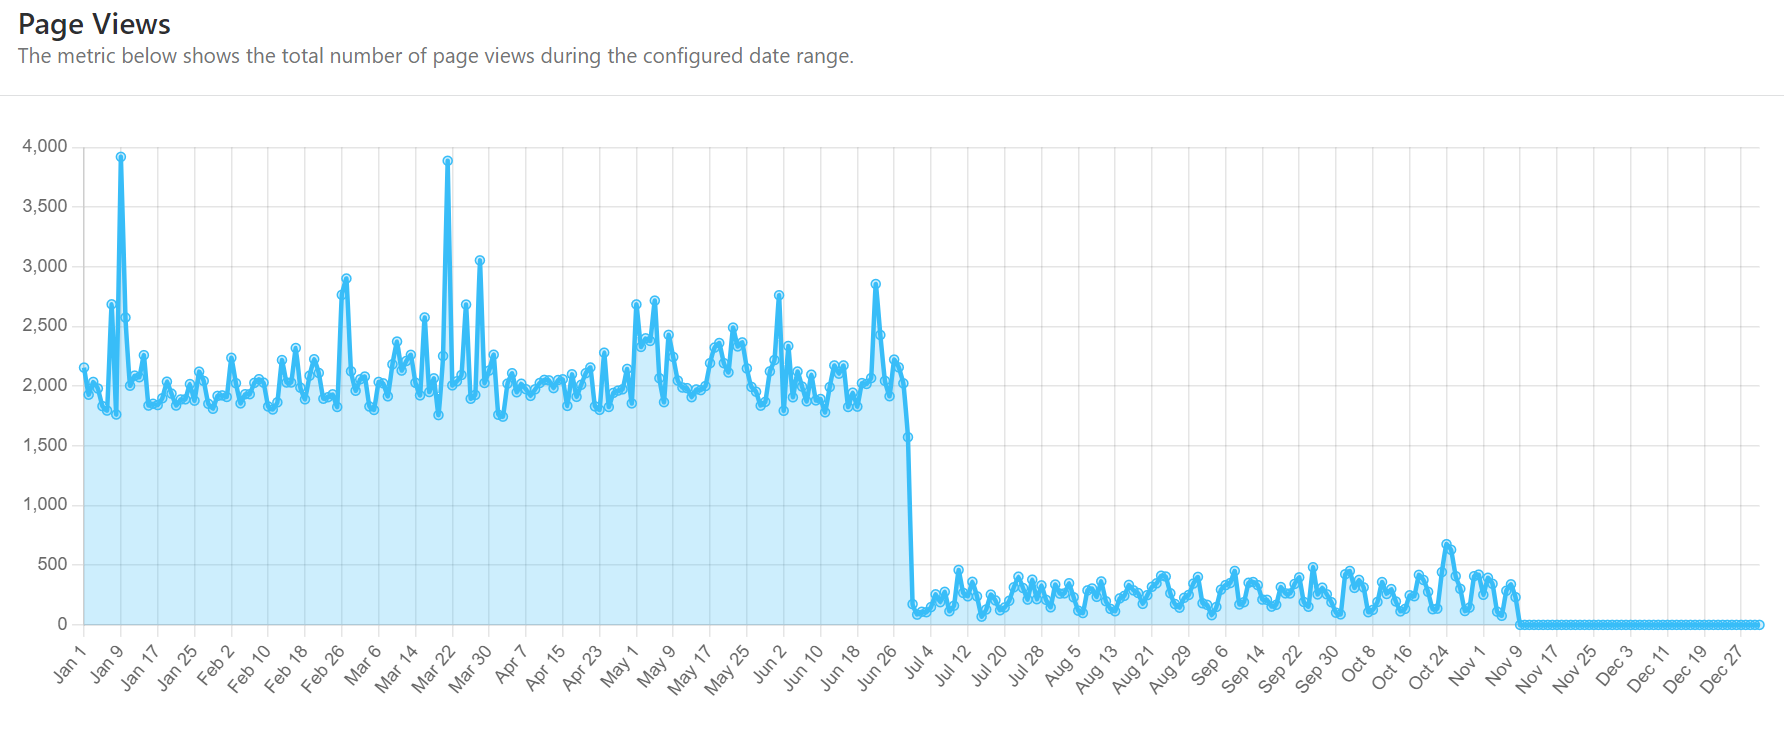
This change does not affect your actual traffic or your site’s performance. Going forward, Rock will attempt to filter bots, and only display interactions from real users. You can still compare your traffic trends over time and see how your site is performing. You can also adjust the date range of your reports to see the data before and after the change.